Tag Archives: junk science

Turtles all the way down

I found a copy of the latest gun control paper, Firearm Ownership and Domestic Versus Nondomestic Homicide in the U.S., the summary of which I found troubling.

Oh. My.

The short form is that Kivisto et al claimed to have found a definite relationship of more firearms ownership = more domestic firearms homicides. But, somehow, not nondomestic homicides.

First, I had an issue with their “validated proxy” for firearms ownership, and wondered just what that is.

Thus, a recently developed proxy measure of firearm ownership that integrates the FS/S ratio with per capita state hunting license data (firearm ownership % = (0.62 × FS/S) + (0.88 × per capita hunting licenses) − 4.48)8 was used.

They created a model (ding!) of gun ownership rates by mathematically manipulating suicide and hunting numbers.

“FS” is suicide by firearm, and “S” is total suicides. Then they used that to create a model by multiply it by a fudge factor of 0.62. (ding!)

Moving on to the “hunting license” part of the equation; once upon a time, I sold “hunting licenses,” so I see a potential problem there. Depending on the state, there are a lot of “hunting licenses.”

  • Firearm hunting
  • Non-firearm muzzleloader hunting
  • Non-firearm archery hunting
  • Combination hunting and fishing

I know I sold combo licenses to people who said they didn’t have a gun, but wanted to keep their future options open. I sold muzzleloader licenses to people who said they couldn’t own a firearm. Just saying “hunting license” means squat. And I can’t find anything in the paper or supplemental data to indicate they used only some form of firearm-specific hunting license.

For that matter, I sold hunting licenses to adults and minors who didn’t own a firearm, but would be borrowing one.

Then there are resident and non-resident licenses. Did they break that out? They don’t say.

So they created another model (ding!) by using an undefined number of licenses, which may or may not involve firearms and multiply that by yet another fudge factor.

So firearms ownership rate equals a proxy based on fudge-factored value plus fudge-factored value.

I think there may be just a little uncertainty in that.

Moving on, I had wondered how they got domestic firearms homicide numbers from the UCR. They didn’t.

From Table 10 theycan  get victim/perp relationship numbers, but not weapon type. Table 9 breaks murders down by weapon.

So they made a model (ding!) of “domestic firearms homicides” by guesstimating that those followed the same weapon percentage as all murders.

But… the model is incomplete because most states don’t report victim/perp relationship. So they created another fudge-factor and applied that to all states. A model based on a model. (ding! ding! We got a two-fer!)

No uncertainty there at all; no, sirree.

Let put all this plainly in case you lost track. They compared…

  • Firearms ownership (fudged suicide rates plus fudged license numbesr that may not have anything to do with guns)
  • Domestic firearms homicide (a fudged estimate of two-thirds of the “data” based on an estimate of total in a few states)

And got numbers precise to three decimal places, with overlapping confidence intervals (domestic and non-domestic homicides) and determined a definite relation of domestic to ownership, but not non-domestic to ownership.

Again, definitely different even though CI overlaps. The “difference” is lost in the statistical noise.

Modified models of modified models compared to modified models of modified models.

It’s turtles all the way down.

[Permission to republish this article is granted so long as it is not edited and the author and The Zelman Partisans are credited.]

Carl is an unpaid TZP volunteer. If you found this post useful, please consider dropping something in his tip jar. He could really use the money, what with ISP and web host bills. And the rabbits need feed. Click here to donate via PayPal.
(More Tip Jar Options)
Facebooktwitterredditpinteresttumblrmail

Update: Need Got a copy of a gun control paper

Specifically, I need a copy of Firearm Ownership and Domestic Versus Nondomestic Homicide in the U.S., Kivisto et al 2019, or a nonpaywalled link.

Added: And I finally found it. Looks like I’ll be going over it today.


The paper purports to find a definite link between domestic firearms homicide and firearms ownership. However, without seeing the whole paper and supplemental material, I’m inclined to doubt this link.

Let’s start with the results.

State-level firearm ownership was uniquely associated with domestic (incidence rate ratio=1.013, 95% CI=1.008, 1.018) but not nondomestic (incidence rate ratio=1.002, 95% CI=0.996, 1.008) firearm homicide rates, and this pattern held for both male and female victims.

When you have to run your ratio out to three decimal places, I begin to wonder, unless you’re modeling statistical quantum interactions between elementary particles. Shouldn’t need to be done with a few thousand documented events. When your 95% confidence intervals overlap, I really wonder if the “difference” is merely statistical noise.

But, again without seeing the data, I see more problems in the methods sections

Firearm ownership was examined using a validated proxy measure and homicide rates came from the Supplemental Homicide Reports of the Federal Bureau of Investigation’s Uniform Crime Reports.

What “validated proxy measure” of firearms ownership? I’ve recently seen both the General Social Survey and YouGov.com used. Other estimates range from 45,000,000 gun owners to — seen this past Monday morning — 124,000,000. CBS actually estimated ownership by registered NFA items, not quite comprehending that’s not a proxy for states that don’t allow NFA items to be possessed.

You think a range like that might throw off incidence ratios a bit?

The next problem is that “homicide rates came from the Supplemental Homicide Reports” part. You might get the impression they got domestic firearms homicide numbers from the UCR. I don’t think so.

I’ve never been able to find a UCR table that broke that out. So what I think they did was “estimate” what percentage of firearms homicides (which are reported) were “domestic.” That’s another element of uncertainty.

Frankly, if one could reliably estimate firearms ownership, I would expect more domestic and nondomestic firearms deaths with more ownership, for much the same reason that a place with more cars per capita is likely to see more car crashes. But I can’t figure out what “data” they used to prove it.

This has the feel of just another anti-rights hit piece. But if Kivisto can show they used hard data and models somewhat more accurate than a kindergartener’s Play-Do sculpture, I’ll apologize.

If someone really wants to compare gun ownership to domestic firearms incidents, I’ll explain how to go about it.

Don’t make up estimates based on anonymous phone surveys.* Select just states with handgun registration (long guns are a small enough percentage of murder weapons to disregard for this). That ignores unlawful possession, but it’s something.

In those states, go to the state courts for domestic violence conviction records, and sort for those involving firearms. You want both fatal and nonfatal. Using fatal alone doesn’t tell you how often they happen, and incidents could be masked by good medical care or poor aim. You want convictions to weed out good self-defense cases, because some otherwise helpless woman eliminating a thuggish “boyfriend” who thinks trying to kill her is justifiable pest control and a good thing.

Graph each state, incidents on the X axis, ownership on the Y.

If you really want to drill down into the data, look at the convictions and see how often the weapons were lawfully possessed (i.e.- were unlawful possession charges present). (I’ll give you a hint: over 90% of crime guns used — per inmate surveys for decades — were unlawfully possessed.)

Now you can compare lawful firearms possession to domestic firearms homicides.

But wait, as Ron Popeil would say, there’s more.

Look up nonfirearm domestic homicides for those states, and compare that to ownership. Now you’ll see whether, as some suggest, people without guns simply kill with something else. Or maybe they just declare, “Aw, heck; I don’t have a gun. Guess I won’t do anything about you sassing me. Ain’t like I could beatcha to death with a skillet.”


* Anonymous phone surveys on ownership of politically incorrect tools are unreliable. Those disinclined to tell faceless pollsters what easily stolen goods they have often don’t answer the phone. Or they lie. After all, was that really the University of Chicago doing the GSS by wardialing pseudorandom phone numbers? The ATF with a list of potential investigatees? Or merely a burglar pre-casing the neighborhood? Caller ID is so easily spoofed.

Even if you got a gun ownership question into the oh-so-reliable American Community Survey… Let me tell you about the guy who answered those snoopy questions…

By filling it out as his D&D player character. Castel with suites, ballroom, feasting hall, jakes, stables; you get the idea. People in the home? Domestic retainers and soldiers. Commute time? Those quests can range for hundreds of miles.

Or all the crazy cat people listing their pets as children.

[Permission to republish this article is granted so long as it is not edited and the author and The Zelman Partisans are credited.]

Carl is an unpaid TZP volunteer. If you found this post useful, please consider dropping something in his tip jar. He could really use the money, what with ISP and web host bills. And the rabbits need feed. Click here to donate via PayPal.
(More Tip Jar Options)
Facebooktwitterredditpinteresttumblrmail

Goyal et al Study: Universal Background Checks vs. “Child” Deaths

A Childrens National doctor claims to have found that universal background checks reduce child firearms deaths by a whopping 35%. That’s rather astonishing.

State Gun Laws and Pediatric Firearm-Related Mortality
The presence of these laws was associated with a >35% lower rate of firearm-related mortality, even after adjustment for socioeconomic factors and gun ownership.

I was going to do an all-out analysis of this paper, since just from the press release I knew it had problems (cross-sectional analysis, without longitudinal; 18-21yo “children”), but this persuaded me to not waste that much time.

These data were used to select firearm-related deaths per year for those aged ≤21 years by state, except in states with <10 annual firearm-related deaths where the counts were suppressed.

Allow me to summarize: We compared death rates in states with gun control laws to state without, and found those states with the laws had fewer deaths once we tossed out the low death/no-law states.

You see, we can look up the states with the laws in question and see that their numbers of deaths exceeded the threshold for inclusion. Therefore, it had to be states without those laws that they tossed.

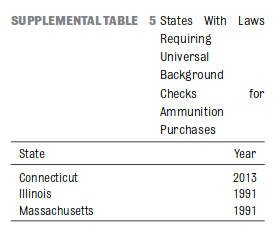
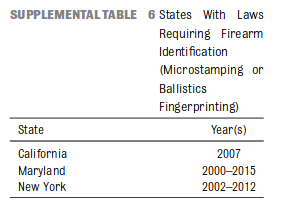
When I thought I was going to write all this up, I took a look at their supplemental information. Look at Table 5.

They confused a firearm owner identification card requirement for actual background checks on transactions.

Table 6, and even the inclusion of a microstamping/ballistic fingerprinting law, was simply pointless. Maryland and New York gave up fingerprinting because it never worked (pro-tip: the average “time to crime” for a firearm is over ten years, by which time the rifling and firing pin have been changed by a decade of wear or replacement, so it’s useless). California’s microstamping law is even more pointless because no commercial gun has it (and would be subject to the same wear).

Oh. And they cited Kellerman.

-sigh-

So, starting with bad data, and excluding data that would invalidate their thesis, they did a cross-sectional comparison only, with no longitudinal analysis to find an effect of implementation of background check laws on in-state trends. A UC Davis study found no effect on homicide or suicide rates in the ten years after California’s passage of a universal background check law. More recently, California has seen an increase in firearms homicides.

The firearm homicide rate, which adjusts for population changes, increased by 15 percent from 2014 to 2016.

I can only speculate why they excluded 2016 and 2017, for which WISQARS data are available. Particularly since those years saw a 17.25% increase in 0-21yo firearms deaths over the 2011-2015.

And even so, a 35% decrease in fatalities seems odd, since approximately 96% of guns used in crimes were obtained through theft or trafficking, bypassing background checks; and at least 75% of murderers were prohibited persons due to felony convictions (60% alone), misdemeanor domestic violence convictions, rulings of mental illness, or court orders. Add in drug users (like this guy) and the percentage is even higher.

Just another BS paper with a pre-set agenda, lacking in anything resembling science.

[Permission to republish this article is granted so long as it is not edited and the author and The Zelman Partisans are credited.]

Carl is an unpaid TZP volunteer. If you found this post useful, please consider dropping something in his tip jar. He could really use the money, what with ISP and web host bills. And the rabbits need feed. Click here to donate via PayPal.
(More Tip Jar Options)
Facebooktwitterredditpinteresttumblrmail

An Active Imagination

This sounds impressive, doesn’t it?

Locking Up Guns Could Reduce Teen And Childhood Firearm Deaths By A Third
Most US households with children do not safely store firearms in the way the American Academy of Pediatrics recommends: locked up and unloaded. If parents simply locked up all their guns, then up to a third of gun suicides and accidental deaths among children and teens could be avoided, researchers estimate in a new study.

Cut by a third. I think we need to take a look at the study, Association of Increased Safe Household Firearm Storage With Firearm Suicide and Unintentional Death Among US Youths, itself instead of taking channel 13’s word for it.

This modeling study using Monte Carlo simulation estimated that 6% to 32% of youth firearm deaths (by suicide and unintentional firearm injury) could be prevented, depending on the probability that an intervention motivates adults who currently do not lock all household firearms to instead lock all guns in their home.

So the researchers actually came up with an oddly wide range of 6% to 32% (which is less than a third). So far, so good. That would be nice to know. How did they do that?

DESIGN, SETTING, and PARTICIPANTS: A modeling study using Monte Carlo simulation of youth firearm suicide and unintentional firearm mortality in 2015. A simulated US national sample of firearm-owning households where youth reside was derived using nationally representative rates of firearm ownership and storage and population data from the US Census to test a hypothetical intervention, safe storage of firearms in the home, on youth accidental death and suicide.

This wasn’t even a dubious “synthetic control” (make up imaginary states by selectively combining real states) study. Simulation. They didn’t use real data. They made it up. Then they applied “hypothetical intervention” to their imaginary data.

For the record, you can stop right there. The “study” is meaningless. But the fact that their “youth” includes 18 and 19 year old adults would have told you that anyway.

I also found it amusing that they created their imaginary country using firearms numbers and storage methods gathered in the National Firearms survey, in which 45% of selectees declined to participate, leaving only those stupid enough to tell strangers how many guns they have and how they’re stored, if even if they are locked up.

Then there is this:

we assumed that all deaths resulted from firearms kept in homes where youth resided.

Invalid assumption, which even the most cursory web search could have told them. Even The Trace admits that 1 in 5 youth suicides are committed with guns not kept in the person’s home.

I could go about things like them doing a study about 0-19 year olds but using data from studies on 0-17, or that gun-owning adults (18, 19) need only unlock their safely stored gun and do the deed. Instead, let me explain how they could have come to meaningful conclusions.

At least a dozen states have so-called “safe storage” laws. For each state, graph the unintentional firearms death rate per 100,000 for people 0-17, for the period of 1999 to 2017 (years chosen because their readily available in WISQARS).

Then graph the firearms suicide rates for the same group and period.

Now identify the point in time when the safe storage law went into effect in each state.

Note the trend. Did the rate increase or decrease abruptly? Did the pre-law trend simply continue? Are there other discontinuities in the trend at other points in time which you can correlate to some known event (such as a sudden increase during a period of high unemployment)?

Compare the trends of the states. Did each state experience the same trend (more likely to be a correlation with the storage law), or do the differ significantly?

We have 30-something states without “safe storage” laws. Pick a dozen of those, preferably states with otherwise similar demographics as one of the “safe” states; the idea being to minimize the effect of non-safe storage factors.

Graph the same data for the same period, and analyze for the same trends.

How do the “unsafe” trends compare to the “safe” trends?

Now you have data to support a real conclusion.

But wait! There’s more.

Run another set of state by state graphs; this time for number and rate of firearms-related murders. We want to see if locking up one’s security had any negative effects. Saving one kid at the expense of 2-3 murder victims is expensive.

If you really want to be comprehensive, graph home burglaries and violent crime rates for the same period. Did locking up security embolden burglars and rapists?

But real data might not give you the results you want.

[Permission to republish this article is granted so long as it is not edited and the author and The Zelman Partisans are credited.]

Carl is an unpaid TZP volunteer. If you found this post useful, please consider dropping something in his tip jar. He could really use the money, what with ISP and web host bills. And the rabbits need feed. Click here to donate via PayPal.
(More Tip Jar Options)
Facebooktwitterredditpinteresttumblrmail

Lax Gun Laws, or Lax Research Standards?

If you keep up with firearms-related news, you may have seen this report:

Lax state gun laws linked to more child, teen gun deaths, Stanford study finds
Compared with U.S. states with the strictest gun control legislation, gun deaths among children and teenagers are twice as common in states with the most lax gun laws, a study from the Stanford University School of Medicine has found.

This is just a press release; how accurately it presents the research is anyone’s guess. I requested a copy of the paper, but at this time all that is available is a one-page abstract without details which will presumably be presented on November 5, 2018. For now, assume the release is good.

Which means the research is not. I see a few major problems with it.

Chao’s team used 2014 and 2015 data on firearm deaths of individuals 0 to 19 years old from the National Vital Statistics System, which is maintained by the Centers for Disease Control’s National Center for Health Statistics. About 2,715 children died of firearm injuries each year. Of those deaths, 62.1 percent were homicides, 31.4 percent were suicides and the remaining deaths were accidental, of undetermined intent or the result of legal interventions.

If you are studying the effects of laws on children, it behooves you to use the legal definition of child. 18 U.S. Code § 2256 defines “child” as a person under the age of 18.

That matters, because 18-19 year-olds can lawfully possess firearms. If an adult wants to take his lawfully owned, securely stored firearm out and do something stupid, he can.

Why include adults in a study of children? I suspect they did it for two reasons: Partly because these are pediatrics specialists who generally (if foolishly) lump together everyone from zero to twenty-one. I say “foolishly,” because any nurse will tell you that using the same drug regime — just for example — on a 21yo adult and a prepubescent boy is asking for trouble.

But mostly I think they did it to get scary numbers for “child” gun deaths.

About 2,715 children died of firearm injuries each year.

According to WISQARS, for the years 2014 and 2015 (the years examined by the study), the numbers for 0-19 were 2,548 and 2,824, respectively. An average of 2,686 which is fairly close to the PR claim.

Ah, but actual children; that’s another story altogether; 1,330 and 1,458, respectively, for 0-17yo. That’s lower by 1,218 and 1,366. By adding in adults, they the scary numbers by thousands of “child” deaths, which is far more impressive to the gullible.

Adults who could possess their own guns and bypass “safe storage” at will.

If that’s who caused the deaths. This is a statistical correlation between the age of decedents and laws. It doesn’t address the age of the perpetrators, except in the case of suicide. Were the murders — a majority of the deaths — committed by adults who could lawfully bypass “child access protection laws” with their own guns?

Moving on…

The researchers examined the firearm laws of all 50 states.
[…]
Analyses of the relationship between gun deaths and gun laws were controlled for many socioeconomic and demographic factors, including unemployment rates, poverty, urbanization, alcohol dependence, tobacco and marijuana use, and high school graduation rates. The analyses also accounted for the strictness of gun laws in each state’s neighboring states and the number of registered firearms per 100,000 children in each state.

That’s a neat trick remarkable accomplishment, since only nine states have any form of firearms registration at all. Only a handful attempt to register all firearms, some only register handgun sales by licensed dealers and do not track them over the firearm’s life cycle.

How did they derive a registered firearm rate for 41 states that have no registration whatsoever? And more that only track — sometimes partially — handguns?

That firearm life cycle is important, too. Which brings us to another problem.

The researchers used the years 2014 and 2015 for their study, presumably because that is the last year for which they could find a Brady Scorecard. That presents a snapshot of deaths at the time specific gun control laws were in effect. And that means nothing, because it does not examine the laws in effect when (and where) a firearm used in a death was obtained.

We already know that roughly 90% of firearms used in crimes are stolen (which is part of the researchers’ point, since they believe “safe storage” laws will prevent thefts leading to deaths), but when were they stolen? Were those “safe storage” laws in effect at that time?

We don’t know, because the researchers only looked at 2014-2015. But according to the ATF the average time-to-crime (from when the firearm is lawfully sold until it is used in a crime) is more than a decade.

The researchers need to examine death rates versus laws over a long period to look for pre- and post-law trends, to see if there is a measurable effect. They would also have to look at the source of the firearms used, to see if the laws were in effect at that location.

In short, a death in gun-controlled California tells you nothing about laws a decade before in another state.

This is a bit nit-picky, but I also have a problem with adjusting the number of deaths for demographic factors. A poor dead person is as dead as a rich dead person. If they wish to examine the effectiveness of laws on poor vs. rich, black vs. white, et cetera, that’s fine and I’d like the see the results. But that’s a separate study, or at least should be presented as a separate set of results.

And a note for whoever drafted the press release…

(The score is named for James Brady, who has advocated for gun control since being permanently disabled in the 1981 assassination attempt on Ronald Reagan.)

“Has advocated since” implies he’s still at it (to the extent that his pre-mortem “activism” largely consisted of being rolled out on display by his wife, Sarah Brady). Brady died more than 4 years ago.

More correctly, the scores were obtained from the “scorecard” issued by the group, National Council to Control Handguns, which was renamed after Brady.


Carl is an unpaid TZP volunteer. If you found this post useful, please consider dropping something in his tip jar. He could really use the money, what with truck repairs and recurring bills. And the rabbits need feed. Truck insurance, lest I be forced to sell it. Click here to donate via PayPal.
(More Tip Jar Options)

Facebooktwitterredditpinteresttumblrmail