
The latest gun people control argument making the rounds is a “report” from the Violence Promotion I-mean-Policy Center that purports to show:
U.S. Gun Death Rate Jumps 17 Percent Since 2008 Supreme Court District of Columbia v. Heller Decision Affirming Right to Own a Handgun for Self-Defense
Oh, dear. Heller is killing people.
Not. Let’s take a look at the VPC’s own chart demonstrating that dramatic jump post-Heller.
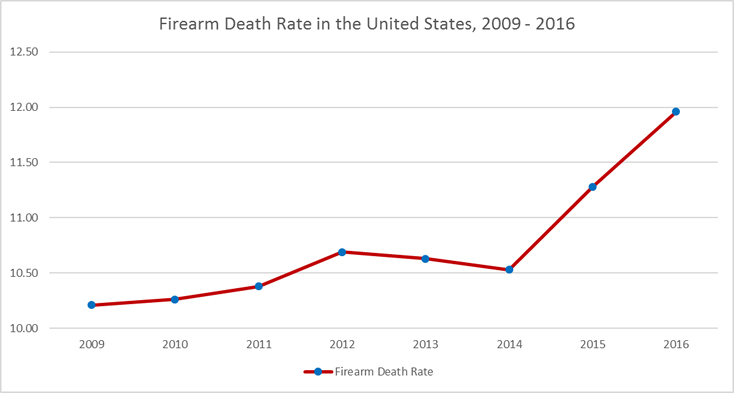
Hmm. Modest increases through 2012; but nothing dramatic. Still well below the long-term average and part of a long term decline in firearms-related deaths. But look where we do see a dramatic jump: 2015 and 2016. That starts 7 years after Heller.
You’d think that if Heller were the cause, we’d see that big increase a little sooner. My uneducated, troglodytic gun owner guess would be that something changed in 2014 or 2015; maybe 2013 or 2016. But what?
2013:
- New York passes “NY SAFE” act )assorted bans, registration, licensing, universal firearms PPYI, ammo PPYI, and more).
- Colorado launches universal PPYI checks, “high capacity” magazines bans, mental health reporting requirements.
- Maryland passes its “Firearm Safety Act,” called “one of the strictest gun laws in the nation.” (Sure helped Baltimore reach its goal of one of the highest homicide rates in the world, eh?)
2014:
- California begins keeping more firearms sales records and bans “high capacity” magazine sales.
- Connecticut begins “assault weapon” and “high capacity” magazine registration.
- Obama launched his “Gun Violence Reduction Executive Actions;” 23 new executive orders intended to restrict honest folk.
- Obama announces his intent to expand DACA protections for illegals.
Washington passes I-594 PPYI checks.
2015:
- Oregon launches universal PPYI.
- California somehow found something about guns not already regulated to their taste and added several more restrictions, including confiscations.
- Alabama prohibited more people possessing firearms, and required more reporting.
- Obama ordered the ATF to increase FFL licensing requirements, increase hiring, boost NICS reporting, and make many SS disability recipients prohibited persons.
- Virginia’s AG reneged on reciprocal carry agreements.
2016:
- California expands firearms seizures, blocks campus carry, imposes ERPOs
And much more.
Granted, none of that establishes causation, but at least the temporal correlation is a lot closer than a SCOTUS decision years back. And about that decision…
Heller was specifically about District of Columbia firearms restrictions. Not national laws. It was important at the national level because everyone expected it — correctly — to be used as a precedent in future. But to blame Heller itself for an increase in deaths indicates a simplistic… nay, simple-minded understanding of law and precedent.
It wasn’t until the SCOTUS McDonald decision two years later that Heller‘s precedent was applied to all the states. Funny that the VPC report doesn’t even mention that case.
Carl is an unpaid TZP volunteer. If you found this post useful, please consider dropping something in his tip jar.

The chart is disingenuous at best, an outright lie at worst (and I think we can agree which of those two is more likely the case). In particular, note the slight uptick in “gun deaths” from 2009-2010, and the slightly larger one from 2010-2011. There’s a small-but-definite increase displayed in the VPC’s cute little chart.
HOWEVER….
Here’s the 2013 report on firearm violence from the DoJ’s Bureau of Justice Statistics: https://www.bjs.gov/content/pub/pdf/fv9311.pdf (Yes, this is a PDF — be warned). It shows these numbers for “firearm homicides” in those three years (the last years covered by the report):
2009: 11,493
2010: 11,078
2011: 11,101
And here is the estimated population of the U.S., by year: https://en.wikipedia.org/wiki/Demography_of_the_United_States#Vital_statistics_2
The estimated U.S. population for those same three years is such:
2009: 307,007,000
2010: 309,330,000
2011: 311,583,000
Dividing one by the other gives us the following firearm death rates, per 100,000 people:
2009: 3.74
2010: 3.58
2011: 3.56
The rate is declining through those years, but the chart shows a slight increase. Additionally, the VPC chart is labelled so that the “rate” is between 10 and 10.5, and not the 3.5-3.75 range the data shows.
But wait, there’s more.
Just for sh*ts and giggles, let’s also include 2008 and 2007– the year of the Heller decision and the year immediately prior — for an apples-to-apples comparison pre- and post-Heller:
“Firearm deaths”:
2007: 12,632
2008: 12,179
Estimated U.S. population:
2007: 301,580,000
2008: 304,375,000
“Firearm death” rate, 2007-2011:
2007: 4.19
2008: 4.00
2009: 3.74
2010: 3.58
2011: 3.56
That’s a pretty dramatic decline immediately post-Heller. The honest truth is that “gun death” rates have been generally declining since 1993, and Heller didn’t affect that trend to any statistically significant degree.
But the VPC apparently doesn’t want us to see that. I wonder why that is….
The chart is disingenuous for a couple of reasons. Partly, while you’re — correctly — addressing homicides (murder, specifically), the VPC is supposedly looking at ALL firearms-related deaths, which includes accidents and suicides.
Fine. Let’s allow that for purposes of discussion. We still have a problem. According to CDC’s WISQARS, firearms-related deaths (all intents) for 2008-2015 is
Not the difference between what VPC claims for 2015 vs what WISQARS shows. WISQARS is publicly available. The report VPC claims to use… well, I haven’t found that one. I have found another, but its data doesn’t match VPC either (also lower).
That thought — that VPC is including suicides-by-firearm, as gun grabbers are often wont to do — occurred to me after writing my comment. It’s really the ONLY way their numbers even begin to make sense.
Still unaddressed, however, is how the Heller decision affects people determined to commit suicide, which was part of their original premise.
To whit: How does the affirmed right to keep a functional (read: not locked or disabled) firearm in the home, in Washington, D.C., enable suicide nation-wide? Inversely, how does a Washington, D.C., requirement to keep firearms locked and/or disabled prevent suicide nation-wide?
They have not answered these questions, and they won’t. Because they can’t.
And the folks who find VPC reports credible won’t ask anyway.
I will stay out of this one, because you both have made such perfect points. Just wanted to let you know that I am still here and so glad you are not backing down, now that we have a political landscape that should have been more inclined to help our cause, but instead it has been business as usual for the D.C. cowards. I am trying to get more into state level political fights, and just vote strictly for 2nd amendment candidates on the national level. I at least have a chance to affect change in the state at a much greater level. I am in MI, so while others have it worse, there is much work to do still on the state level in MI that I can get behind and help. Perhaps it will have a trickle up effect. Did you know that in MI, I can carry a knife with a blade longer than 4″ , as long as I don’t intend to hurt anyone? I am not sure how the state figures out my intentions, but I’m going to find out, along with many other things
Keep up the fight, and watch your 6, the left is getting desperate and will stoop lower than one might think.
The reason is THIS:
August 2014 – FERGUSON RIOTS
After Ferguson – policing became HANDS OFF in inner city crime zones – the homicide rate skyrocketed.
Baltimore – Milwaukee
Police no longer could police these areas – the Obama Administration made sure of that – Achieving a federal takeover of “RACIST” police agencies effectively tied the hands of police in minority areas that most needed policing.
(Ideological side benefit – spectacular statistics being generated to support the need for CITIZEN DISARMAMENT!)